Economics : 2019 : CBSE : [Delhi] : Set2
To Access the full content, Please Purchase
-
Q1
If the market supply of a commodity X changes due to improvement in technology, the market supply curve will _____.( Fill up the blank)
Marks:1View AnswerAnswer:
shifts to the right.
Explanation:
If the market supply of a commodity X changes due to improvement in technology, the market supply curve will shifts to the right, as it causes an increase in supply at the existing price of the commodity.
-
Q2
If the market supply of a commodity X changes due to rise in price of a factor input, the market supply curve will _______. (Fill up the blank)
Marks:1View AnswerAnswer:
Shift to the left.
Explanation:
If the market supply of a commodity X changes due to rise in price of a factor input, the market supply curve will shift to the left, as it increases the cost of production which leads to a decrease in supply at the existing price of the commodity.
-
Q3
The average product curve in the input-output plane, will be ____(Choose the correct alternative)
(a) an 'S' shaped curve
(b) an inverse 'S' shaped curve
(c) a 'U' shaped curve
(d) an inverse 'U' shaped curve.
Marks:1View AnswerAnswer:
(d) an inverse 'U' shaped curve.
Explanation:
Average product refers to the output per unit of the variable factor used in the process of production.
The average product curve in the input-output plane will be an inverse 'U' shaped curve.
-
Q4
Average fixed cost curve _______. (Choose the correct alternative)
(a) is a straight line parallel to X-axis.
(b) is straight line parallel to Y-axis.
(c) falls, as more units are produced.
(d) rises, as more units are produced.
Marks:1View AnswerAnswer:
(c) falls, as more units are produced.
Explanation:
Average fixed cost curve slopes downwards to the right. It shows that AFC decreases as output increases.
-
Q5
Which of the following formula is correct for calculating marginal cost?
(a) MCN = TFCn – TFCN-1
(b) MCN = ACN – ACN-1
(c) MCN = AVCN – AVCa-1
(d) MCN = TCn – TCN-1
Marks:1View AnswerAnswer:
(d) MCN = TCn – TCN-1
Explanation:
Marginal cost is the addition to the total cost due to the addition of one unit of output.
-
Q6
In the given figure, the movement on the production possibility curve from point A to point B shows ________. (Choose the correct alternative)
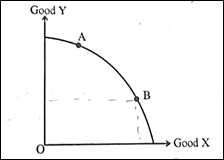
(a) Growth of all the resources in the economy.
(b) Underutilisation of resources.
(c) Production of more units of Goods X and less units of Good Y.
(d) Production of more units of Good Y and less units of Good X.
Marks:1View AnswerAnswer:
(c) Production of more units of Goods X and less units of Good Y.
Explanation:
In the given figure, the movement on the production possibility curve from point A to point B shows production of more units of Goods X and less units of Good Y.
-
Q7
Identify and discuss the nature of the following newspaper reports in terms of positive or normative economic analysis:
(i) "India jumped 23 points in the World Bank's ease of doing business index to 77th place, highest in 2 years," – The Economic Times
(ii) "Government should further liberalise the business rules." – The Economics Times.
Marks:3View AnswerAnswer:
(i) "India jumped 23 points in the World Bank's ease of doing business index to 77th place, highest in 2 years," – The Economic Times
- It is a positive economic analysis
Reason: Positive economic analysis describes what was, what is and what would be under the given set of circumstances. Positive statements are capable of empirical verification.
(ii) "Government should further liberalise the business rules." – The Economics Times.
- It is a normative economic analysis
Reason: Normative economic analysis describe “what ought to be”. Its objective is to determine the norms. Normative statements pronounce value judgment or an opinion relating to right or wrong of a particular policy matter and it is always a matter of debate.
-
Q8
Good X and Good Y are substitute goods. If price of Good X increases, discuss briefly its likely impact on the demand for Good Y.
Marks:3View AnswerAnswer:
If Good X and Good Y are substitute goods and if the price of X is increased then it will lead to an increase in quantity demanded for Good Y because in case of substitute goods the quantity demanded for the good is positively related to the price its substitute good.
Substitute goods can be consumed at the place of one another. If price one good increases its demand falls, as the consumer will replace it with its substitute. Hence, the demand for substitute good will increase. For example tea and coffee, petrol car and diesel car.
-
Q9
If the income of a consumer increases, discuss briefly its likely impact on the demand for an inferior good, Good X.
Marks:3View AnswerAnswer:
If good X is an inferior good, and the income of the consumer increases, than the demand for good X will decrease because in case of normal good, income and demand are inversely related.
For example if income of a consumer increases, his demand for inferior crop such as bajra decreases.
-
Q10
Complete the following cost schedule:
Quantity (in Units)
0
1
2
3
4
Total cost (in
 )
)200
……..
……..
……..
490
Total variable cost (in
)0
……..
180
……..
……..
Average variable cost (in
)……..
100
……..
80
……..
Marks:4View AnswerAnswer:
Quantity (in Units)
0
1
2
3
4
Total cost (in
)200
300
380
440
490
Total variable cost (in
)0
100
180
240
290
Average variable cost (in
)0
100
90
80
72.5