Economics : 2019 : CBSE : [All India] : Set 1
To Access the full content, Please Purchase
-
Q1
The shape of the average revenue curve under perfect competition would be ________. (Fill up the blank)
Marks:1View AnswerAnswer:
parallel to X-axis
Explanation:
The shape of the average revenue curve under perfect competition is parallel to X-axis. It is because in perfect competition, commodities are sold at uniform prices and the price is equal to marginal revenue which is equal to average revenue.
-
Q2
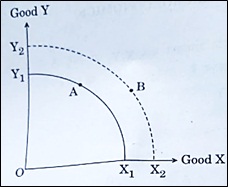
Shift from point A on Production Possibility Curve X1Y1 to Point B on X2Y2 in the given figure indicates: (Choose the correct alternative)
(a) Decrease in resources
(b) Increase in resources
(c) Full and efficient utilitsation of resources
(d) Wastage of resources
Marks:1View AnswerAnswer:
(b) Increase in resources
Explanation:
In the given figure, PPC has shifted to right at all points, it implies that the production of both the goods has increased at given the level of technology.
-
Q3
A Production Possibility Curve (PPC) would be convex to the origin if Marginal Rate of Transformation (MRT) is ______. (Fill up the blank)
Marks:1View AnswerAnswer:
decreasing
Explanation:
Marginal Rate of Transformation = Δ Y/ Δ X is continuously decreasing. It implies that in order to produce more of one good X, we have to sacrifice more units of good Y.
-
Q4
Mention any two examples of implicit cost incurred by a firm.
Marks:1View AnswerAnswer:
The two examples of the implicit cost incurred by a firm are as follows:
- Use of own building for production purposes by factory owner, and not receiving rent.
- Use of own capital to purchase machinery for the production and not charging any interest
-
Q5
Define variable cost.
Marks:1View AnswerAnswer:
The expenditure made on the purchase of a variable factor of production or to hire casual labourer is termed as variable cost.
-
Q6
The coefficient of price elasticity of supply of a good is 3. It is known as _________. (Choose the correct alternative)
(a) Unitary Elastic Supply
(b) Perfectly Inelastic Supply
(c) Elastic Supply
(d) Inelastic Supply
Marks:1View AnswerAnswer:
(c) Elastic Supply
Explanation:
When there is more percentage change in quantity supplied due to a percentage unit change in price, it is known as elastic supply.
-
Q7
Discuss briefly the central problem of ‘‘How to produce’’.
Marks:3View AnswerAnswer:
This problem is related to the decision regarding the manner in which goods and services should be produced. In other words, the problem is to choose either labour intensive technique or capital intensive techniques. This problem arises because there is more than one possible way in which goods and services can be produced.
When a particular method of production is chosen than the other, it affects the structure of the whole economy. For example, a developing country chose labour intensive techniques because labour is available in abundance and it is government task to provide jobs.
-
Q8
Classify the following statements into positive economics or normative economics, with suitable reasons :
(a) The autonomy of the central bank of a country should be maintained as per the law.
(b) Nominal Gross Domestic Product (GDP) is calculated on the basis of ‘current year prices’.
Marks:3View AnswerAnswer:
(a) Normative Economics
Reason: Normative economic analysis describes “what ought to be”. Its objective is to determine the norms. Normative statements pronounce value judgment or an opinion relating to right or wrong of a particular policy matter and it is always a matter of debate.
(b) Positive Economics
Reason: Positive statements describe what was, what is and what would be under the given set of circumstance. All the statements are verified empirically.
In the given situation, Nominal Gross Domestic Product (GDP) is calculated on the basis of ‘current year prices’ which can be verified with available data.
-
Q9
Discuss the relationship between total utility and marginal utility, using a hypothetical schedule.
Marks:3View AnswerAnswer:
Total utility is defined as the total psychological satisfaction derived from the given stock of the commodity consumed. It can be estimated as the sum total of marginal utilities derived from the commodity.
TU =∑MU
Marginal utility is defined as the utility derived from the additional unit of the commodity consumed. It can be estimated as the change in TU due to change in one unit of the commodity consumed.
MUn = TUn - TUn – 1
For example, if the consumption of first unit of the commodity gives the satisfaction of 20 utils and the consumption of the second unit of the commodity gives 15 utils of satisfaction, then the total utility derived from consumption of one commodity is 20 utils and from consumption of two commodities will be 35 utils and the marginal utility for the consumption of the second unit will 15 utils.
Unit MU TU 1 20 20 2 15 35 3 12 47 4 10 57 -
Q10
With the help of the given schedule, determine the firm's equilibrium using marginal revenue – marginal cost approach. Give valid reasons in support of your answer.
Output
(in units)
Total Revenue (TR)
(in ₹ )
Total Cost (TC)
(in ₹ )
1
20
20
2
40
30
3
60
36
4
80
40
5
100
60
6
120
90
Marks:4View AnswerAnswer:
A firm attains its equilibrium using marginal revenue – marginal cost approach at units where MR= MC and MC is rising.
Output
(in units)
Total Revenue (TR)
(in ₹ )
MR
Total Cost (TC)
(in ₹ )
MC
1
20
-
20
-
2
40
20
30
10
3
60
20
36
6
4
80
20
40
4
5
100
20
60
20
6
120
20
90
30
The given firm attains equilibrium at 5th unit of production.
Marginal revenue is the revenue (including normal profit) by selling one more unit of good. Marginal cost is the cost of producing one more unit of the good. At the point where MR=MC, the firm is earning exactly the same amount, it is spending on producing it. If it continues to produce after the 5th unit, its MC is more than the MR which indicates a loss. So, it is profitable for firm to produce till the level where MR=MC.