Economics : 2012 : CBSE : [All India] : Set I
To Access the full content, Please Purchase
-
Q1
What is the behaviour of Marginal Revenue in a market in which a firm can sell any quantity of the output it produces at a given price?
Marks:1View AnswerAnswer:
MR curve is a horizontal straight line parallel to X-axis and MR is equal to price.
-
Q2
What is a price-maker firm?
Marks:1View AnswerAnswer:
Price maker firm is that firm who decide the price of a commodity.
-
Q3
Give one reason for a shift in demand curve.
Marks:1View AnswerAnswer:
Change in income
-
Q4
What is the behaviour of Total Variable Cost, as output increases?
Marks:1View AnswerAnswer:
Total variable costs increases as output is increased.
-
Q5
Define microeconomics.
Marks:1View AnswerAnswer:
Microeconomics deals with the individual parts of the economic system such as individual households, individual firms or industries.
-
Q6
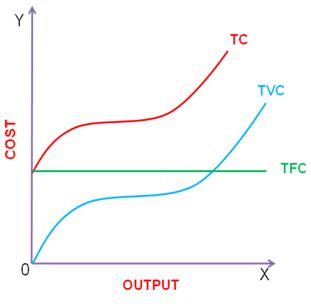
Draw Total Variable Cost, Total Cost, and Total Fixed Cost curves in a single diagram.
Marks:3View AnswerAnswer:
-
Q7
Explain the implications of large number of sellers in a perfectly competitive market.
Marks:3View AnswerAnswer:
Implication of large number of sellers in the market is that the share of each seller in total market supply is so small that no single seller can influence the price. As result each firm is said to be price taker in perfect competition.
-
Q8
Explain why there are only a few firms in an oligopoly market.
Marks:3View AnswerAnswer:
In an oligopoly market, only a few firms exist so that each firm produces a substantial part of total output of the industry. The number of firms is so small that each seller knows that he can influence the price by his own action and he can provoke opponent firms to react.
-
Q9
A consumer consumes only two goods X and Y and is in equilibrium. Price of X falls. Explain the reaction of the consumer through the utility Analysis.
Marks:3View AnswerAnswer:
if price of X falls, consumer will buy more quantity of X till then
MUx = MUyWhere
MUx= Marginal utility of good X
MUy= Marginal utility of good Y
A consumer attains equilibrium where marginal utilities of both the goods are equal.
-
Q10
Define Production Possibility Curve. Explain why it is downward sloping from left to right.
Marks:3View AnswerAnswer:
Production Possibility Curve (PPC) shows all combinations of two goods which can be produced with available technologies and given resources which are fully and efficiently employed.
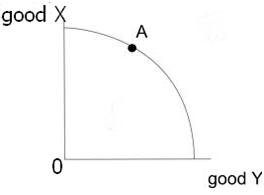
The PPC is downward sloping from left to right because in a situation of full employment, production of one good can be increased only when the production of other good falls.