Economics : 2004: CBSE: [ Delhi ] : Set I
To Access the full content, Please Purchase
-
Q1
Explain the meanings of normal goods and inferior goods. Marks:3View AnswerAnswer:
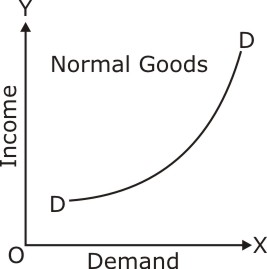
The goods which have positive income effect is said to be normal good. i.e whose demand goes up when the income goes up. Thus there is positive relation between Income and demand for normal goods. Income demand curve of normal goods slopes upward leftwards. It may be shown as under:
The goods, which are of inferior quality good and constitute a major part of total consumption. These goods have negative income effect i.e. when the demand goes down the income goes up. Thus there is a negative relation between income and demand for inferior goods. Income curve of inferior goods slopes down rightwards as shown in the following figure: 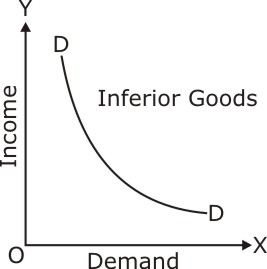
-
Q2
State three main features of a monopoly market. Describe any one . Marks:3View AnswerAnswer:
A monopoly (from the Greek language monos, one + polein, to sell) is defined as a persistent market situation where there is only one provider of a product or service, in other words a firm that has no competitors in its industry .
Following are the thre main features of monopoly market:
Ø Only one firm in market
Ø No close sustitute of the product
Ø Strong barriers to entry
Entry of new Firms: Under monopoly no new firm can enter the industry. There are strong barriers which restrict new firms to enter the industry. There is only one firm producing the producing the product. The firm may enjoy control over raw material, patent and legal protection. -
Q3
At a price of Rs 8 per unit, the quantity supplied of a commodity is 200 units. Its price elasticity of supply is 1.5. If its price rises to Rs. 10 per unit, calculate its quantity supplied at the new price. Marks:3View AnswerAnswer:
Given:
Existing price(P)= Rs 8
Existing Supply (Q)=200 units
New Price (P1)=Rs 10
Change in price ( 
)= 10-8 =Rs 2
Price Elasticity of supply (Es)=1.5
Price elasticity of supply= 
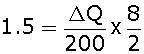
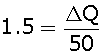

New Supply=Existing Supply +change in supply
=200+75=275 units. -
Q4
What does a production possibility curve show? When will it shift to the right? Marks:3View AnswerAnswer:
We know that every economy has limited resources, which can be used to produce different combination of goods and services. If we make our economy very simple with only two choices then Production possibility curve is a curve which shows all possible combinations of two goods that can be produced by making full use of given resources and technology. Suppose an economy decides to produce only wheat and cloth. If all the resources are used for the production of wheat only then 100 lake tones of wheat can be produced. Or all resources are used for the production of cloth then 4,000 bales of cloth can be produced. Between these two extremes there can be many combinations, which can be produced. These can be shown by a schedule. Goods Production Possibilities A B C D E Wheat (lakh tones) 100 90 70 40 0 Cloth (‘000 bales) 0 1 2 3 4 The PPC shifts to the right only if there is growth of resources. In such case the production possibilities of both the commodities will increase.
-
Q5
Calculate Gross National Disposable Income from the following data: Rs. (Crores) (a) National income (b) Net current transfers from rest of the world (c) Consumption of fixed capital (d) Net factor income from abroad (e) Net indirect taxes 2,000
200
100
(-) 50
250Marks:3View AnswerAnswer:
Gross National Disposable Income = National Income+ Consumption of fixed Capital +Net Indirect Taxes +Net current transfers from rest of the world
=2,000+100+250+200= Rs 2,550 crores -
Q6
Distinguish between average propensity to consume and marginal propensity to consume. The value of which of these two can be greater than one and when? Marks:3View AnswerAnswer:
Average propensity to consume refers to the ratio of aggregate consumption expenditure to aggregate income thus
APC= Consumption
Income
Marginal Propensity to consume refers to The proportion of income that is consumed out of additional income thus
MPC= 
The value of APC may be greater than one when at low level of income consumption exceeds income.
-
Q7
What is a government budget? Name two sources each of non-tax revenue receipts and capital receipts . Marks:3View AnswerAnswer:
A government budget is an annual statement of the estimated receipts and expenditure over a fiscal year. Following are the main objectives of budgetary policy : (a) The first part describes the overall picture of the financial performance of the government since last budget. (b) The second part describes the financial plans up to its next budget.
The two sources of non tax revenue receipts:1. License Fees. 2. Fines and penalties.
Following are two sources of capital receipts:
1.Loan from public
2.Foreign debt -
Q8
In an economy marginal propensity to consume is 0.75. If investment expenditure is increased by Rs. 500 crores, calculate the total increase in income and consumption expenditures. Marks:3View AnswerAnswer:
Marginal Propencity to cousume = 0.75
Multiplier =
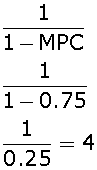
Total Increase in income= Increase in investment x Multiplier
=500x4
=RS 2,000 crores
Increase in consumption expenditure=Increase in incomex Marginal propensity to consumec =2,000x0.75
= Rs 1,500 crores -
Q9
1. Answer the following questions:
a. What causes a downward movement along a supply curve of a commodity?
b.Why does the problem of choice arise?
c.Under which market form, a firm is a price-taker?
d.Define fixed cost. Marks:4View AnswerAnswer:
a. A fall in the price of a commodity causes a downward movement along a supply curve of a commodity
b. The problem of choice arises due to scarcity of resources in relation to unlimited wants.
c. Under Perfect Competition a firm is the price taker
d. Fixed cost are those costs which do not change with the change in the level of output while variable cost changes with the change in the level of output. -
Q10
Define market supply of a good. Give three causes of a rightward shift of supply curve . Marks:4View AnswerAnswer:
Supply is the total quantity of goods that all producers want to sell at a given price during a particular time. It may be defined as the estimates of quantity supplied of the good by all the firms per time period at various alternative prices.
There are following three reasons of rightward shift of supply curve:
(i) Fall in the cost of factors of production: When the cost of factors of production goes down the producer can employ more factor inputs. Therefore the supply curve will shift to the right.
(ii) Use of improved technology: Due to use of better technology, the unit cost of production will decrease and supply will increase. As a result the supply curve will shift to the right.
(iii) Fall in the prices of other commodities: If the prices of all other commodities fall then these commodities become relatively less attractive to producer and the supply of the commodity, the price of which has not changed, will become more attractive. Hence its supply will increase and there will be a rightward shift of supply curve.